Showing posts with label meteorology. Show all posts

Sunday, February 1, 2015

Last Week's Winter Storm

Much of New Mexico experienced winter weather last week as a winter storm made it's way across the state.  Snow began to develop in Southern Colorado and Northern New Mexico on the evening of the 20th, continuing on the 21st and finally affecting the Southern part of New Mexico on the 22nd.

The NM Department of Transportation reported several closures over multiple highways across the state.  Schools were also affected.  According to NM news sources, over 90 schools were affected by last week's storm.  Here in Las Cruces, NMSU was closed at 10AM and the Las Cruces Public Schools let out early, allowing staff to leave after 1PM.

Weather station data from last week's storm shows that many locations across New Mexico recorded heavy snowfall.  Other locations saw none at all.  The following map shows CoCoRaHS snowfall amounts across the state.


Although the State Climatologist, Dr. Dave DuBois, was out of town during the storm, the staff at the climate center was able to capture images of the storm as it passed through Las Cruces.

The NMSU weather station taken by Rebecca Britt-Armenta

Another view of the NMSU weather station by Rebecca Britt-Armenta
A neighborhood in Las Cruces by Stanley Engle
Another neighborhood in Las Cruces by Antonio Arredondo

On Another Note


Several weeks ago, the students and staff of the NM Climate Center attended the American Meteorological Society's Annual Meeting in Phoenix, AZ.  This year the theme of the conference was "Fulfilling the Vision of Weather, Water, and Climate Information for Every Need, Time, and Place." We arrived early on the weekend prior to the start of the full meeting to take the Python short course.  As a Python programmer already, I attended the advanced Python short course, while my colleagues, Dr. Dave DuBios, Yizhi Zhao, and Rebecca Britt-Armenta attended the beginner course.

Rebecca and Yizhi learning Python by Dr. Dave DuBois
Every year the conference reaches out to the community by holding a WeatherFest where weather and atmospheric sciences are promoted. This year looked very successful and many kids and their parents attended the event. Here are a few photos from WeatherFest.


On the first Monday of the meeting, I attended the Fifth Symposium on Advances in Modeling and Analysis Using Python.  The major takeaway from this symposium is that Python is here to stay in the atmospheric sciences.  Later on Monday, we attended the exhibit presentations to see the latest and greatest technology available for the atmospheric sciences.
A Davis Vantage Pro2 weather station by Stanley Engle

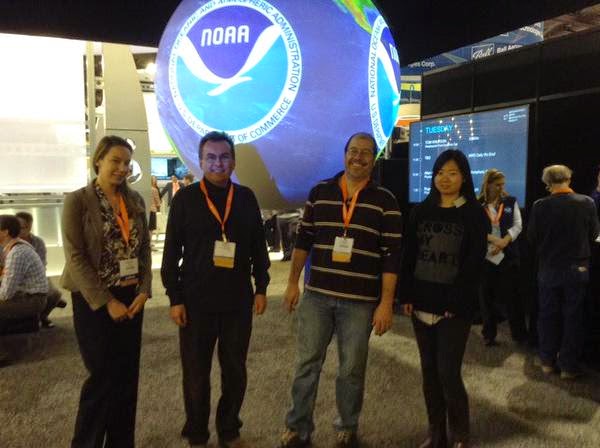
Of course, one of the most popular exhibits is the NOAA Science on a Sphere.  This would be a good place to get a group picture.
Rebecca, Dave, Stan and Yizhi at AMS Annual Meeting 2015
Unfortunately, I had to leave after Monday, but Dr. DuBois, Yizhi and Rebecca stayed for a few more days.  Rebecca found that the most interesting experience at AMS was attending several talks.  A few noteworthy presentations included those in the "Global Warming Hiatus" on the first day of the conference and several sessions on the National Climate Assessment. Dr. DuBois gave the talk A perspective on drought information services at a state climate office.  According to Rebecca, about 30 meeting attendees listened to his presentation.  Below is a view of that presentation.

Monday, November 10, 2014

Modular Environmental Monitoring Sensors (MEMS)

Early last month, the NM Climate Center team built and a Modular Environmental Monitoring Sensor (MEMS) package, which was tested at the 2014 Albuquerque Balloon Fiesta.  The purpose of building and testing the MEMS is to demonstrate our ability to gather data using inexpensive equipment. The hardware was chosen for its low cost and power.


MEMS system parts and functions:


Raspberry Pi – Read data from the Arduino Uno and Dylos.


Arduino Uno Micro Controller – Programmed to read pressure and GPS data from a pressure sensor and a GPS module.  It is connected to the Rasberry Pi via USB.


Dylos Air Quality Monitor - Counts large and small particle sizes and stores the average of both sizes over a minute.  Connected to the Raspberry Pi via Serial-to-USB adapter.


12V Rechargeable Battery - Provides the power to all the components of the system.


Photo 1: MEMS system and parts. By: Cristina González


An Arduino Uno was used to collect GPS and pressure sensor data.  A Raspberry Pi was used to log data from the Arduino serial console; the GPS messages and our own custom data message format for the pressure sensor. In addition to logging data from the Arduino, the Raspberry Pi logged data from the Dylos air quality monitor. A start-up script was created for the Raspberry Pi to trigger data logging on start-up.

The Raspberry Pi, running the Raspbian OS, booted into a standard terminal mode. During the boot process, an init script would start the data collection process from the Arduino and the Dylos serial ports. This data was then stored in an incrementing file name, to prevent overwriting files, over each on-off power cycle. In addition, a one minute file-write timer was built into the logging software to ensure that data was written on a continuous basis, since the sensor package was turned off by having its power removed.

The Raspberry Pi, Arduino Uno, and all power hardware is stored in a Rubbermaid container that is placed inside an inexpensive backpack.  The Dylos is attached to the outside of the backpack to be exposed to the ambient air.

After completing the build process, the MEMS was tested on October 11, 2014 at the Ballon Fiesta (photo 6). It collected data successfully and it will be available soon in the NM Climate Center website.

Photo 2: Building a bracket to hold the Dylos air quality monitor . The bracket is used to securely hold the Dylos to the backpack.  The Dylos had to be exposed to the air outside of the backpack.   Photo by: Stanley Engle


Photo 3: Attaching it to the backpack for trial. Photo by: Stanley Engle
 
Photo 4: Testing it at NMSU. It was left outside for an hour. Photo by: Stanley Engle


Photo 5: Data logger inside the backpack. Photo by: Stanley Engle

Photo 6: Testing the sensor hardware at the Balloon Fiesta. Photo by D. DuBois


Photo 7: Testing the sensor hardware at the Balloon Fiesta. Photo by D. DuBois


Friday, October 31, 2014

Halloween day! Warmest and coldest days of Halloween in the last five years


This is a typical festive night in which people go out to attend costume parties and kids go to "trick or treat". You would like to see how the weather in Las Cruces, New Mexico has been through the last years. The following table shows the highest and lowest records in the last five years for the Halloween Day.


Source: Almanac for Las Cruces Municipal Airport. From http://scacis.rcc-acis.org/
Data from 2009-2013


What weather conditions are expected for the Halloween day and night in Las Cruces?

According to the National Weather Service, Halloween day is going to be mostly sunny, with a high near 71°F. The East southeast winds can be 10 to 14 mph, with gusts as high as 20 mph.  Friday Night will be partly cloudy, with a low around 52°F. East wind 7 to 13 mph.
We have a partly cloudy - windy Halloween day and night!
Enjoy and keep safety in mind!


From: http://www.overthebigmoon.com

-Cristina González

Friday, October 24, 2014

Monsoon season 2014 in New Mexico

The Monsoon season (June 15 to September 30) in New Mexico started with minimum or none rain during June and it was not until early July that we received the first rains but less than one inch. The active period was almost at the end of the season (early-mid September) which provided moisture during these last weeks.  We also had a big event in where received more than 3 inches of rainfall in some zones, mostly in Las Cruces and Southwest NM (figure 2).  The ideal is to receive the rainfall distributed along the entire season in multiple events and not in only one, but it was not the case. We end up with few events in September, including one big event of rain. The inconvenience with this is that we receive a large amount of rainfall in a short period of time and this causes the soil to get saturated and in consequence we have increase in runoff and floods. This was the case of the Mid-September event, in which we received input from the remnants of hurricane Odile (Last week rainfall events-hurricane Odile).
The following maps show the precipitation totals during Monsoon Season for New Mexico State, Albuquerque, and Las Cruces, NM.


Map 1: New Mexico total precipitation during Monsoon Season. Mapped by Yizhi Zhao from NM State Climatologist Office.


Map 2: Rainfall across Albuquerque area during Monsoon Season. Mapped by Yizhi Zhao from NM State Climatologist Office.


Map 3: Rainfall across Las Cruces Area during Monsoon Season. Mapped by Yizhi Zhao from NM State Climatologist Office.


The following graphs show accumulated precipitation for Albuquerque and Las Cruces.
 

Figure 1: Accumulated Precipitation. Weather station: Albuquerque International Airport, NM.  Graph from scacis.rcc-acis.org.


Figure 2: Accumulated Precipitation. Weather station: Las Cruces Municipal Airport, NM. In September 15th-18th, hurricane Odile and moisture from the remnants produced heavy rainfall and caused flooding over the Baja California area and the southwestern United States. The weather station in Las Cruces Municipal Airport registered almost three inches of rainfall for this event.  Graph from scacis.rcc-acis.org.


According to the 2014 North American Monsoon (NAM) Outlook for central and northern New Mexico, a key factor that influenced this Monsoon season was the massive volume of anomalously warm water in the equatorial Pacific Region (2014 North American Monsoon (NAM) Outlook for central and northern New Mexico).

Although these rainfall events caused flood and difficulties, is important to mention that it, by the other side, improved the drought conditions is some zones of New Mexico (Last week rainfall events-hurricane Odile).


Friday, September 26, 2014

Last week rainfall events-Hurricane Odile

During the past week, starting Tuesday 16th, Hurricane Odile and moisture from the remnants produced heavy rainfall and caused flooding over the Baja California area and the southwestern United States.  We had a significant amount of rain in a relatively short period of time. The soil quickly gets saturated and water starts to accumulate.  Here, in New Mexico, we do not have a lot of natural hazards but flooding tops out on the list and causes inconvenience.


Photo 1-Heavy runoff in North of Rodeo, NM. Photo by David DuBois


Photo 2-Heavy runoff in North of Rodeo, NM. Photo by David DuBois
Photo 3-Playa West of Lordsburg, NM. Photo by David DuBois


Flash flood concerned portions of Eastern New Mexico and Western Texas ,but at the same time it eased the droughts in some zones of the Southwest region, where some areas have been experiencing extreme to exceptional drought conditions.  The NM Drought Monitoring Work Group met past Tuesday, 23 of September, for their monthly meeting and they agree in modify the current U.S. Drought Monitor map for New Mexico. According to the Drought Summary from the National Weather Service, Albuquerque NM, drought was removed from portions of southeast New Mexico, but 63% of the state is still in moderate to extreme drought and 30% is still in severe to extreme drought. The none drought category increases from 3 to 16%, which reflects about 13% of improvement in Southwest of New Mexico (figures 1 and 2).


Figure 1: U.S. Drought Monitor Weekly Comparison. Left map shows data from September 16, 2014 and right map shows September 23, 2014.
Source: U.S. Drought Monitor


Figure 2: U.S. Drought Monitor for September 23, 2014.
Source: U.S. Drought Monitor


Monsoon has been active late in the Monsoon season and provided moisture during the past weeks. Input from Hurricane Odile impulsed more humidity this last week.
 Time Lapse of the Organ Mountains on September 19, 2014. Video by D. DuBois


-Cristina Gonzalez

Monday, June 30, 2014

USRCRN Stations

The New Mexico Climate Center will soon be able to gather climate data from even more monitoring stations in New Mexico with the addition of 15 stations that were formerly part of the U.S. Regional Climate Reference Network (USRCRN). Soon the precipitation and temperature data form these sites will be available through our website.

The USRCRN was a pilot project set up in 2009-2011 by NOAA's National Climate Data Center.  The project began in the Southwest United States. The high-quality weather stations in the network are spaced at 130 km spatial resolution and are focused on gathering temperature and precipitation information in order to detect regional climate signals. The sites were carefully chosen and many stations are situated in remote areas. The stations in New Mexico started recording data in 2009. (Note that this network is not the same one as the U.S. Climate Reference Network.)

Map of USRCRN sites in New Mexico and Arizona (shown in black). The blue points are sites in the USCRN network. Map from
 http://www.ncdc.noaa.gov/crn/usrcrn/usrcrn-map.html


Unfortunately, budget cuts mean that the data from many of these USRCRN stations stopped being ingested and made available at the USRCRN website as of June 1, 2014. Five of the stations in New Mexico were de-installed. Theses stations were at Kiowa and Rita Blanca Grasslands (Clayton), BLM near Kenna (Elida),  BLM Hagerman, Kiowa and Rita Grasslands (Mills), and BLM near Ramon (Vaughn). (The equipment from these sites will be divided up and given to climate offices in the Southwestern states.) Management of the 15 remaining stations will be moved to various local individuals and organizations who are willing to help. We have had strong commitments for most of them. (One of these stations is the highest in the network at 10,000 feet on Magdalena Ridge.) The remaining stations will still collect precipitation and temperature data; the issue will be finding a way to ingest that data into our website. We're working now to find a way to get those data into our website.


The USRCRN station at Carrizozo in Lincoln County, New Mexico. 
The following diagram describes the set-up of each station (image from http://www.ncdc.noaa.gov/crn/usrcrn/).


The data loggers on the remaining open stations are still collecting the data from the  precipitation gauges and the temperature sensors. The collected information goes to the GOES satellite through the GOES antenna. Our task is to find a way to get that information from the satellite.