Showing posts with label NM Climate Center. Show all posts

Sunday, February 1, 2015

Last Week's Winter Storm

Much of New Mexico experienced winter weather last week as a winter storm made it's way across the state.  Snow began to develop in Southern Colorado and Northern New Mexico on the evening of the 20th, continuing on the 21st and finally affecting the Southern part of New Mexico on the 22nd.

The NM Department of Transportation reported several closures over multiple highways across the state.  Schools were also affected.  According to NM news sources, over 90 schools were affected by last week's storm.  Here in Las Cruces, NMSU was closed at 10AM and the Las Cruces Public Schools let out early, allowing staff to leave after 1PM.

Weather station data from last week's storm shows that many locations across New Mexico recorded heavy snowfall.  Other locations saw none at all.  The following map shows CoCoRaHS snowfall amounts across the state.


Although the State Climatologist, Dr. Dave DuBois, was out of town during the storm, the staff at the climate center was able to capture images of the storm as it passed through Las Cruces.

The NMSU weather station taken by Rebecca Britt-Armenta

Another view of the NMSU weather station by Rebecca Britt-Armenta
A neighborhood in Las Cruces by Stanley Engle
Another neighborhood in Las Cruces by Antonio Arredondo

On Another Note


Several weeks ago, the students and staff of the NM Climate Center attended the American Meteorological Society's Annual Meeting in Phoenix, AZ.  This year the theme of the conference was "Fulfilling the Vision of Weather, Water, and Climate Information for Every Need, Time, and Place." We arrived early on the weekend prior to the start of the full meeting to take the Python short course.  As a Python programmer already, I attended the advanced Python short course, while my colleagues, Dr. Dave DuBios, Yizhi Zhao, and Rebecca Britt-Armenta attended the beginner course.

Rebecca and Yizhi learning Python by Dr. Dave DuBois
Every year the conference reaches out to the community by holding a WeatherFest where weather and atmospheric sciences are promoted. This year looked very successful and many kids and their parents attended the event. Here are a few photos from WeatherFest.


On the first Monday of the meeting, I attended the Fifth Symposium on Advances in Modeling and Analysis Using Python.  The major takeaway from this symposium is that Python is here to stay in the atmospheric sciences.  Later on Monday, we attended the exhibit presentations to see the latest and greatest technology available for the atmospheric sciences.
A Davis Vantage Pro2 weather station by Stanley Engle

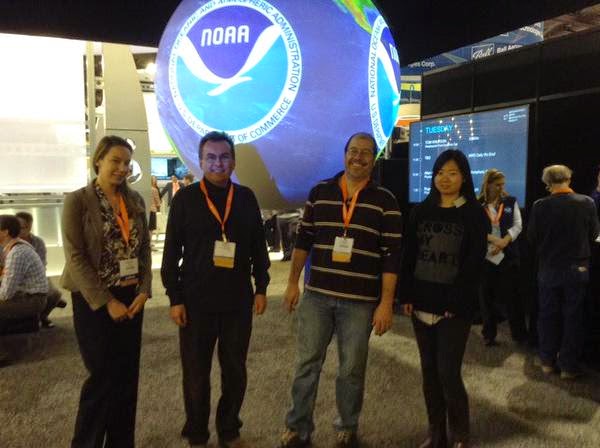
Of course, one of the most popular exhibits is the NOAA Science on a Sphere.  This would be a good place to get a group picture.
Rebecca, Dave, Stan and Yizhi at AMS Annual Meeting 2015
Unfortunately, I had to leave after Monday, but Dr. DuBois, Yizhi and Rebecca stayed for a few more days.  Rebecca found that the most interesting experience at AMS was attending several talks.  A few noteworthy presentations included those in the "Global Warming Hiatus" on the first day of the conference and several sessions on the National Climate Assessment. Dr. DuBois gave the talk A perspective on drought information services at a state climate office.  According to Rebecca, about 30 meeting attendees listened to his presentation.  Below is a view of that presentation.

Friday, October 31, 2014

Halloween day! Warmest and coldest days of Halloween in the last five years


This is a typical festive night in which people go out to attend costume parties and kids go to "trick or treat". You would like to see how the weather in Las Cruces, New Mexico has been through the last years. The following table shows the highest and lowest records in the last five years for the Halloween Day.


Source: Almanac for Las Cruces Municipal Airport. From http://scacis.rcc-acis.org/
Data from 2009-2013


What weather conditions are expected for the Halloween day and night in Las Cruces?

According to the National Weather Service, Halloween day is going to be mostly sunny, with a high near 71°F. The East southeast winds can be 10 to 14 mph, with gusts as high as 20 mph.  Friday Night will be partly cloudy, with a low around 52°F. East wind 7 to 13 mph.
We have a partly cloudy - windy Halloween day and night!
Enjoy and keep safety in mind!


From: http://www.overthebigmoon.com

-Cristina González

Friday, October 24, 2014

Monsoon season 2014 in New Mexico

The Monsoon season (June 15 to September 30) in New Mexico started with minimum or none rain during June and it was not until early July that we received the first rains but less than one inch. The active period was almost at the end of the season (early-mid September) which provided moisture during these last weeks.  We also had a big event in where received more than 3 inches of rainfall in some zones, mostly in Las Cruces and Southwest NM (figure 2).  The ideal is to receive the rainfall distributed along the entire season in multiple events and not in only one, but it was not the case. We end up with few events in September, including one big event of rain. The inconvenience with this is that we receive a large amount of rainfall in a short period of time and this causes the soil to get saturated and in consequence we have increase in runoff and floods. This was the case of the Mid-September event, in which we received input from the remnants of hurricane Odile (Last week rainfall events-hurricane Odile).
The following maps show the precipitation totals during Monsoon Season for New Mexico State, Albuquerque, and Las Cruces, NM.


Map 1: New Mexico total precipitation during Monsoon Season. Mapped by Yizhi Zhao from NM State Climatologist Office.


Map 2: Rainfall across Albuquerque area during Monsoon Season. Mapped by Yizhi Zhao from NM State Climatologist Office.


Map 3: Rainfall across Las Cruces Area during Monsoon Season. Mapped by Yizhi Zhao from NM State Climatologist Office.


The following graphs show accumulated precipitation for Albuquerque and Las Cruces.
 

Figure 1: Accumulated Precipitation. Weather station: Albuquerque International Airport, NM.  Graph from scacis.rcc-acis.org.


Figure 2: Accumulated Precipitation. Weather station: Las Cruces Municipal Airport, NM. In September 15th-18th, hurricane Odile and moisture from the remnants produced heavy rainfall and caused flooding over the Baja California area and the southwestern United States. The weather station in Las Cruces Municipal Airport registered almost three inches of rainfall for this event.  Graph from scacis.rcc-acis.org.


According to the 2014 North American Monsoon (NAM) Outlook for central and northern New Mexico, a key factor that influenced this Monsoon season was the massive volume of anomalously warm water in the equatorial Pacific Region (2014 North American Monsoon (NAM) Outlook for central and northern New Mexico).

Although these rainfall events caused flood and difficulties, is important to mention that it, by the other side, improved the drought conditions is some zones of New Mexico (Last week rainfall events-hurricane Odile).


Wednesday, October 8, 2014

Installing new weather stations to support viticulture in northern New Mexico


On September 26th 2014, two members of the NM Climate Center Team travelled north from Las Cruces to perform maintenance on three weather stations and install a new station.  The maintenance was performed at Ponderosa Valley Vineyard, Corrales Winery, and Los Lunas Agricultural Science Center. The new station was installed at the Estrella del Norte vineyard.


Locations of weather stations. Image from Google Earth.


In cooperation with the New Mexico Climate Center, the NMSU viticulture program is installing weather stations at vineyards across New Mexico.  A Davis Weather Station was installed at the Estrella Del Norte secondary vineyard.  According to Elizabeth Smith, the secondary location was chosen because it is in a topographically challenging area and also is away from the main tourist location.  The owners wished this location to be monitored due to its increased chance of experiencing freezes. Installing the physical station and computer system took approximately 1.5 hours and was maintaining network contact at the time of leaving.


Weather station at Estrella del Norte vineyard. Photo by: Elizabeth Smith

Weather station at Estrella del Norte vineyard. Photo by: Elizabeth Smith

Weather station at Estrella del Norte vineyard. Photo by: Elizabeth Smith


Weather station at Estrella del Norte vineyard. Photo by: Elizabeth Smith


The second location they visited was Ponderosa Valley Vineyard.  The stop was necessitated by poor response from the computer system, so a new computer with updated software was installed. The data stored on the old computer will be sent to the vineyard at a later date.  Communication to the network was working when we left.
The third location, Corrales winery, needed an updated computer as well. Communication to the network was working and stable when leaving.  The Corrales location worked for approximately 7.5 hours before a network error occurred. At Elizabeth's request, the winery re-booted the computer and monitoring resumed within 3 hours.
The last location they went was Los Lunas Agricultural Center. The weather station in this location was failing to record accurate air/soil temperature data.  They also noticed that the station was reporting very low battery voltages.  Therefore, they decided that the problems could be one or all of the following:


1.  A bad battery,
2.  A bad charge controller,
3.  A bad solar panel, or
4.  Bad air/soil temperature sensors.

Once they arrived, Stanley Engle opened the battery box and immediately noticed that the battery terminals were very corroded.  Further, the water level in the battery was very low.  The voltage was 12.5 volts and datalogger was also reporting 12.5 volts.  He covered the solar panel with a black trash bag and recorded 3 volts from the solar panel.  The voltage reported by the datalogger slowly began to fall until it stabilized around 8 volts.  During this time, the datalogger was also showing bad data from the air/soil temperature sensors. Stan uncovered the solar panel and replaced the battery with a new 12v deep cycle marine battery.  He repeated the process of covering the solar panel, however, this time, the datalogger reported voltage of 12.5 volts.  The air/soil temperature reading were also holding steady at reasonable levels.  Uncovering the solar panel also yielded steady 12.5 volts reported by the datalogger and manually measured at the charge controller.  From this process, they concluded that the only issue we had to deal with was the bad battery.  Since then, the voltage and air/soil temperature readings have all been reasonable.


Battery at Los Lunas Agricultural Center. Photo by: Stanley Engle


Finally, the Los Lunas office/weather station Campbell Scientific RF 401 radios were replaced with Campbell Scientific RF 416 radios.  The RF416 radios operate in the 2.4 GHz frequency and are lower transmitting power radios.  Since the Los Lunas weather station is so close to the office, we didn't need higher transmitting power radios.  The RF 401 radios are now available to be used at other locations.


Weather station at Los Lunas Agricultural Center. Photo by: Stanley Engle